
Odoo ships dashboards out of the box: what you sold, leads, average revenue, top customers, invoiced amounts. They work. Albert Cabedo’s video is not about admiring them. It is about building yours. Spreadsheet inside Odoo, filters you already use, a board that opens in the morning without asking for an export.
Session of June 22, 2026, about 52 minutes. Goal: teach you to create the dashboard, not gift you a finished one. Each role filters its own.
the full video
from list to widget
once, so you do not rebuild
the filter every Monday
a clickable demo balance
not a client KPI
What it is for (and for whom)
The factory dashboard shows sales and customers. The real one is yours. Warehouse, sales, HR, or treasury: each one pins a tab. The video teaches the craft (filter → spreadsheet → dashboard), not a universal widget pack.
It is not only the CFO. A warehouse can have today’s orders, reserved stock, and what is still due to arrive on one tab. If the truck comes at four or at six and twenty pickings are left (spoken example), you see it in time. The recipe is the same as in treasury.
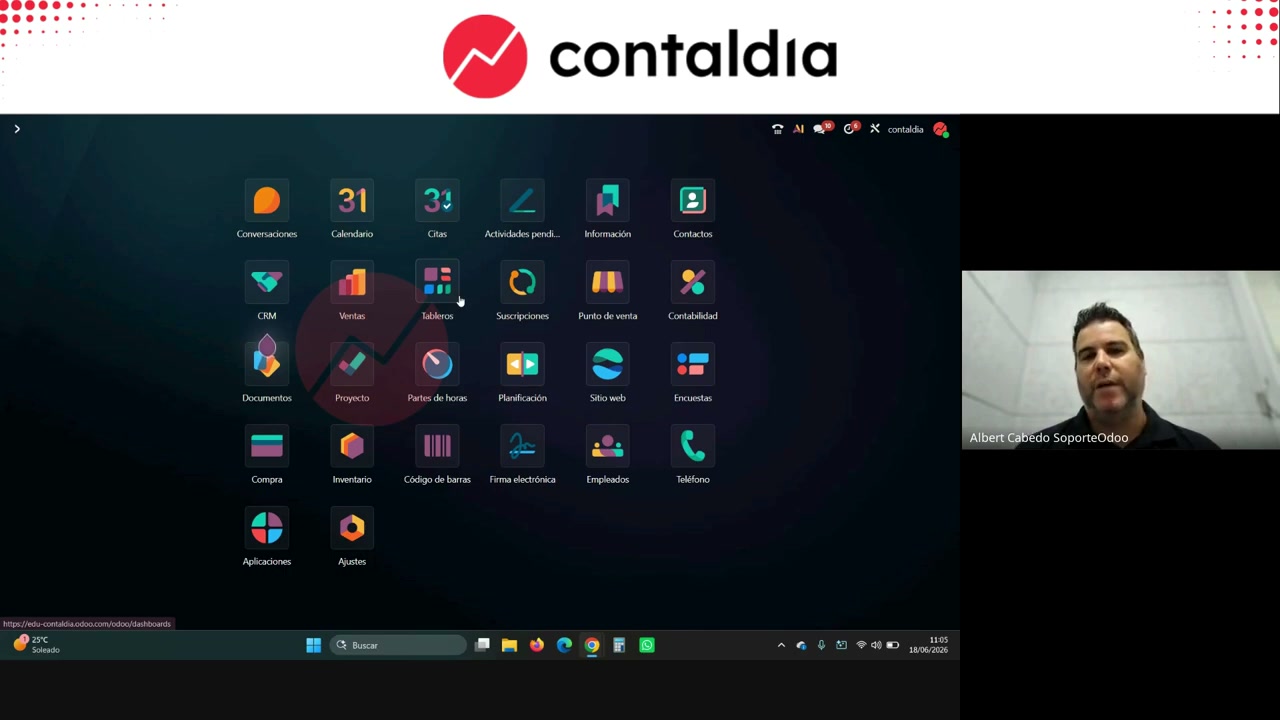
Factory dashboard. Albert advises reviewing it. Then you build yours.
From the view to the widget
Go into the list (tasks, leads, invoices, journal items…). Filter and group until the screen is the question you ask every morning. Insert in spreadsheet —a new one or the one you are already building; in earlier versions the button said insert in dashboard—. Add to dashboard and pick a section (in the demo: CRM). If you do not, the sheet exists and you do not see it.
Edit titles and colors on the sheet. Another table below: copy/paste. F5 on the dashboard. Finance ships a forecast dashboard that you edit like Excel / Google Sheet, with formulas.
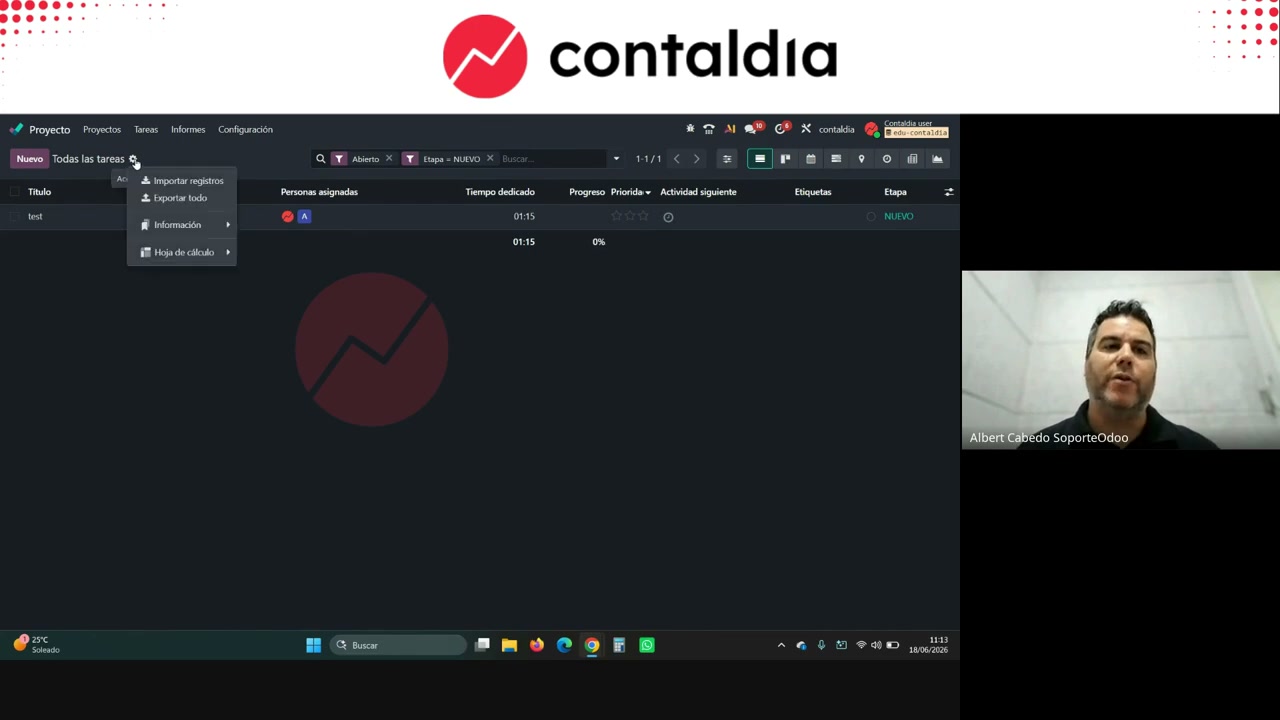
To stack two lists in the same Excel you insert into the existing sheet (another tab). Plain “Add to dashboard” creates another widget. Copy/paste between tabs needs the same column layout. If not, it complains.
Email alarms and CRM (the Contaldia example)
Albert’s rule: emails are answered every day, 24–48 h at most. Mail to the project alias comes in as tasks. Stages he creates in developer mode (Paul and Peter projects): New, Done, In Progress. Peter SL’s alias dumps tasks into New. Example: “new payroll enrollment for Juan.” It is assigned, deadline, tag, and moved to In Progress. New must stay empty: that is the guarantee the email has been touched. You reply even if it is “I’ll do it next week.”
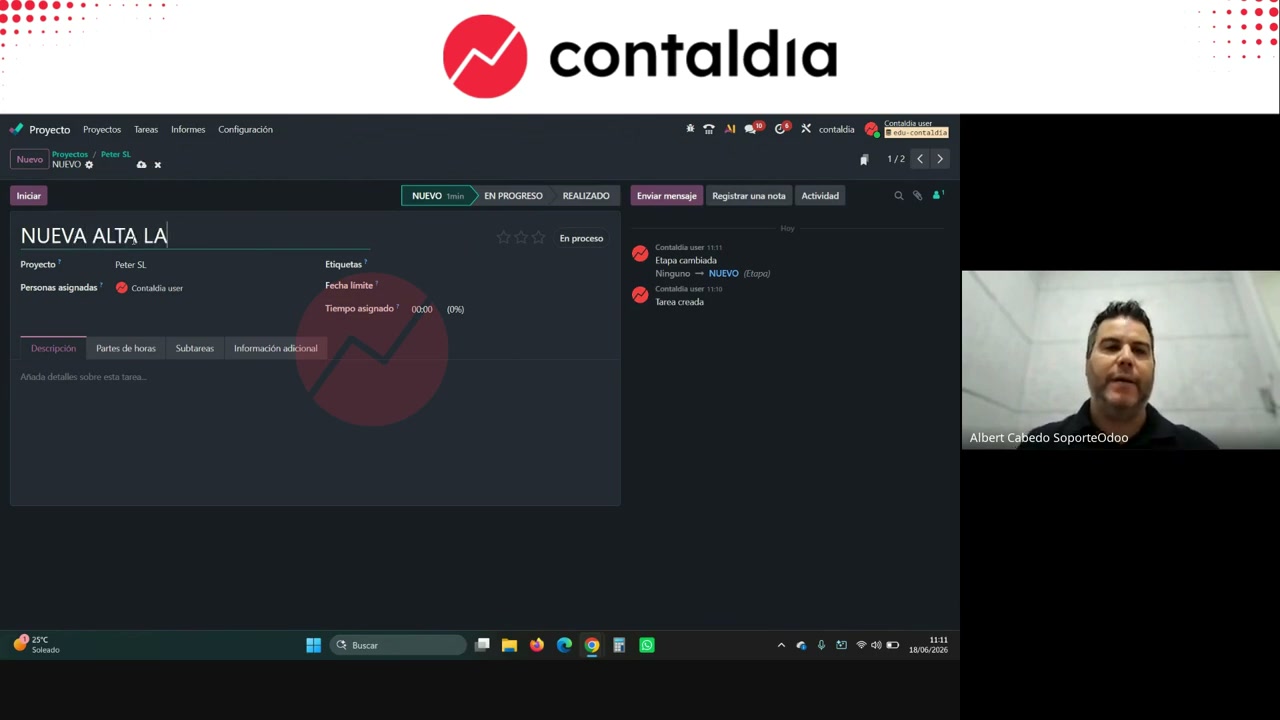
Filters he hangs on the spreadsheet, CRM section: open tasks in New; CRM leads in New (web sign-ups / form); deadline “is not set.” He also cites, without pasting them all: unassigned, overdue activities, overdue deadlines.
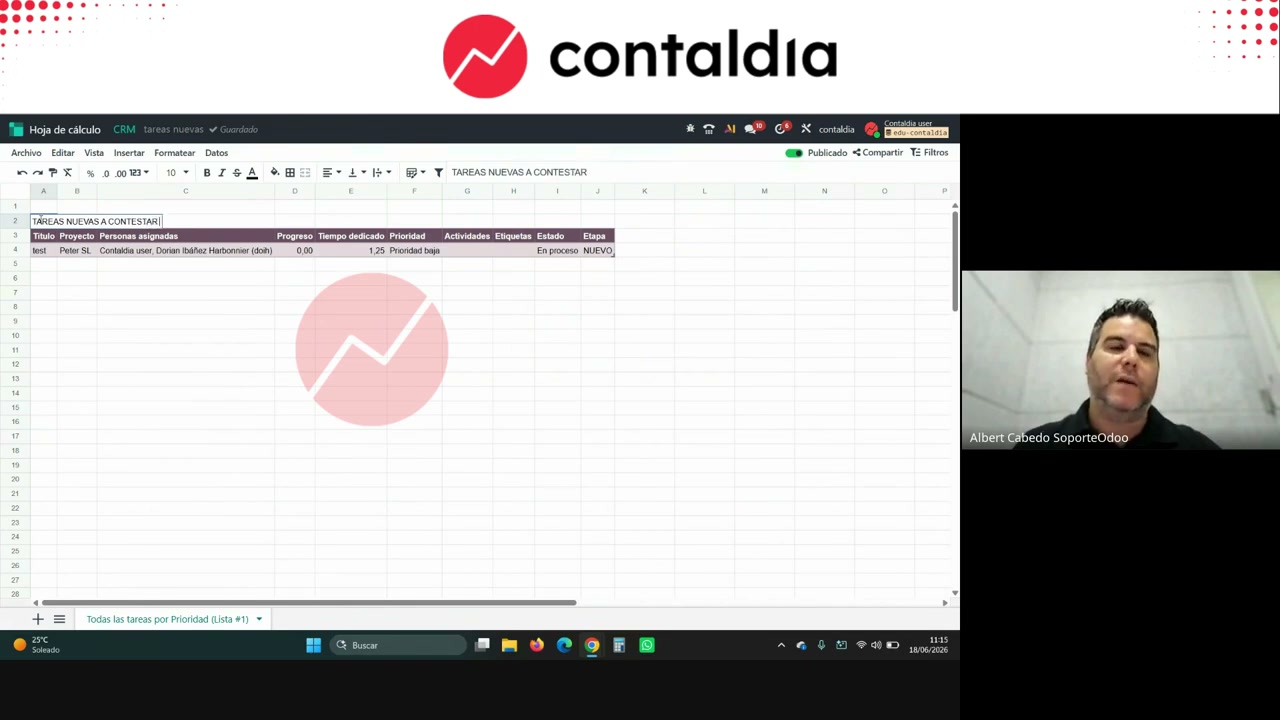
Sheet with a title. By end of day those lists have to be empty.
Collections and warehouse: the same recipe
Customers → unpaid invoices, group by due date / month. Monday, starting point. Insert: “unpaid invoices.” Today’s orders against the transport time. The usual favorites, now in one scroll, or several dashboards by topic (finance, sales, the custom one).
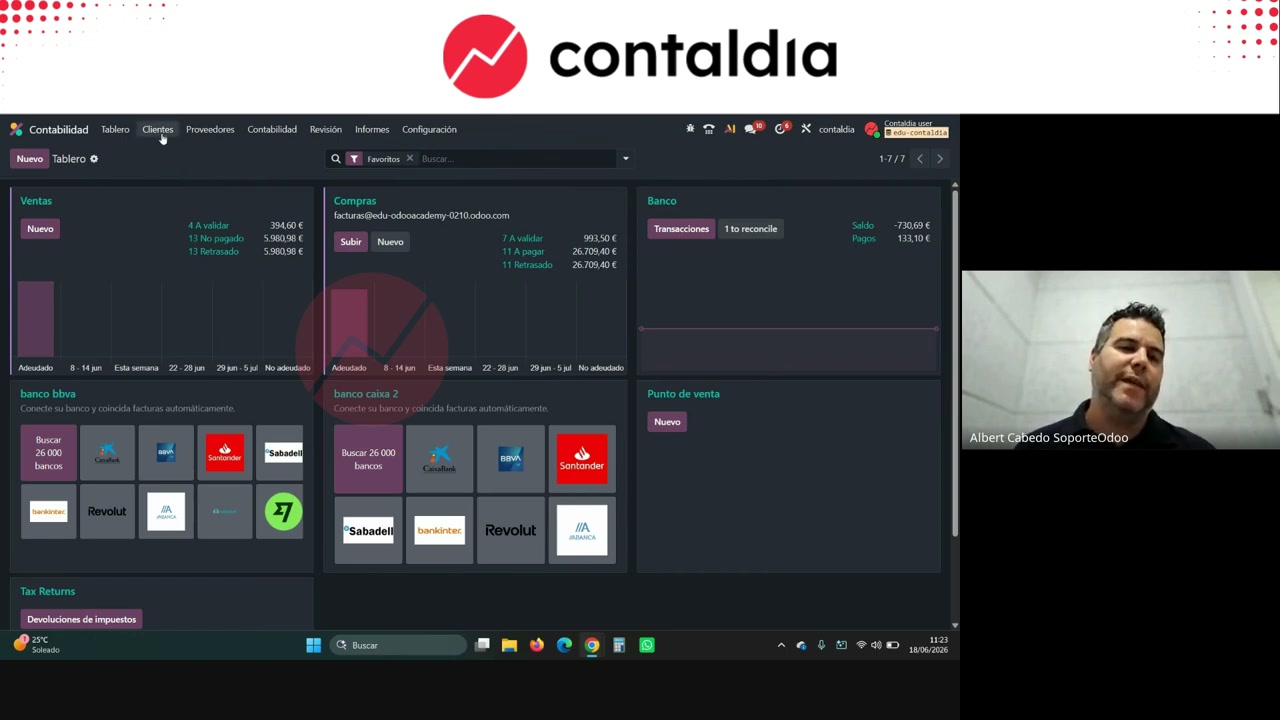
Unpaid by due date and month. Same mechanics: filter, insert, hang.
Editable treasury from journal items
The long dish is a forecast that looks like Excel. Journal items → pivot view. In Odoo 19: Review → Journal Items. In older versions: Accounting → Journal Items. Accounts he puts in: 430 customers, 40 / 410 vendors, 47 taxes, 465 payroll, cash/banks; 52 / 520 if there are loans. He does not put sales: he cares about collection in 3 months, not today’s invoice.
The pivot dumps that account’s balance by month (or week, or date). Insert in spreadsheet, another tab of the forecast. There it is already Excel: SUM of banks, total receipts, total payments, ending balance = banks + receipts − payments. Drag formulas; “build all of 2026 for me in one go.”
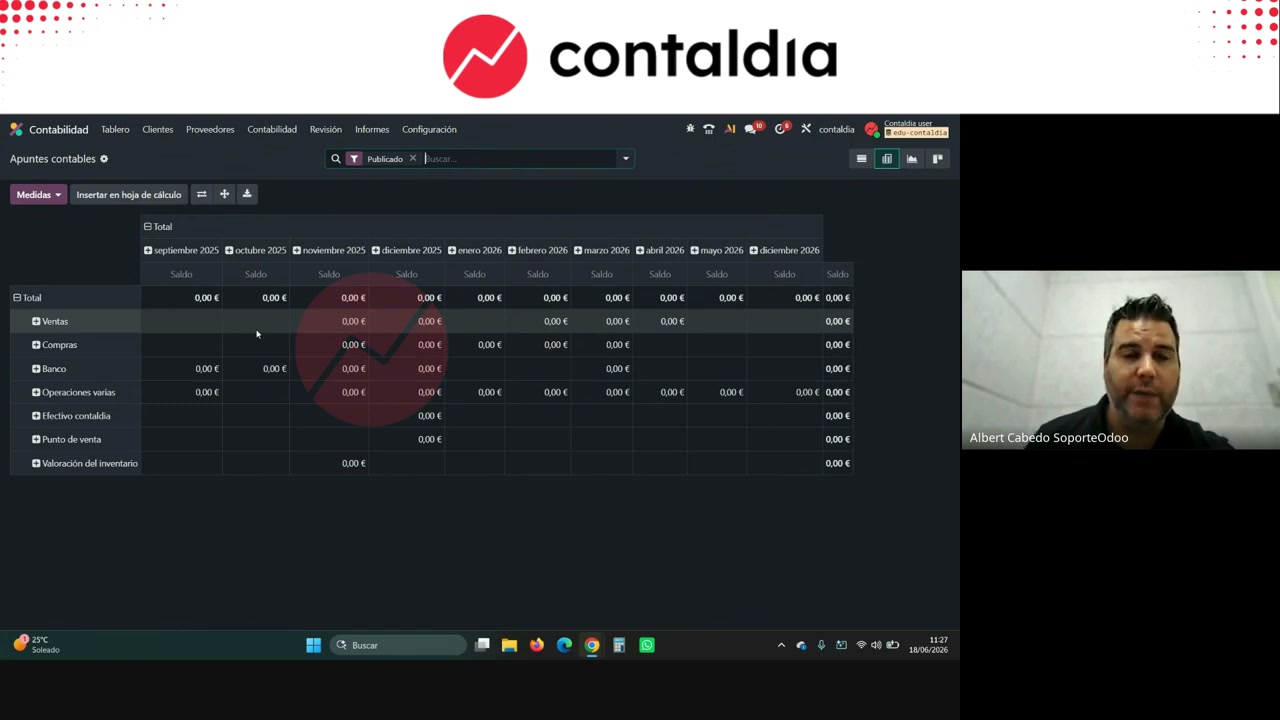
Journal-item pivot. Balance by month. Then it is inserted into the sheet.
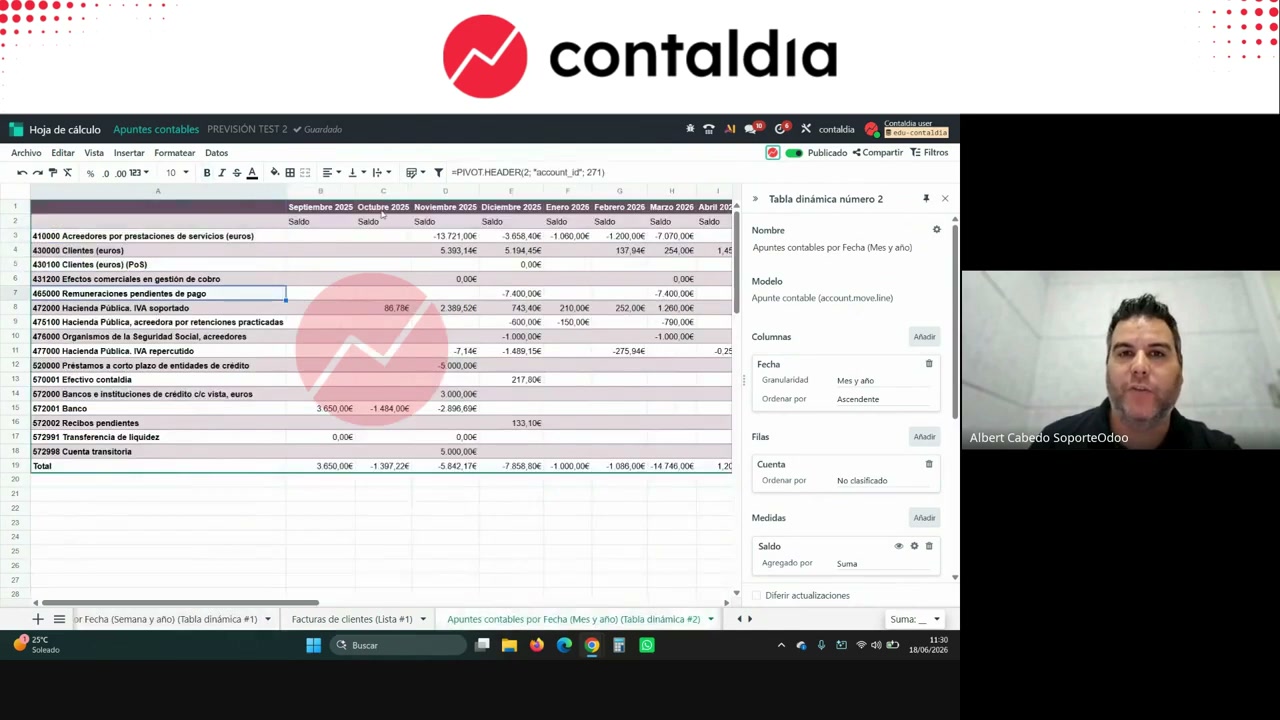
The account in the formula is the id of the account in the chart (the number in the URL when you open it). In the demo, 240 = account 430. Changing the id changes the account. Duplicating a formula and changing the id, yes. Creating from scratch, Albert does not see himself able to.
The sheet updates every time you enter: a new invoice on 430 moves the figure. Manual lines —extra income (10% more, Christmas, 5,000 / 3,000 / 500 as demo examples), extra expenses, fixed structure— are not a formula: if 500 becomes 1,000, you have to edit it. Payroll: either you enter it in Odoo all year and it goes through 465, or an estimate on the sheet. You can split by bank (BBVA, Sabadell, Santander) if each loan/bank has its 520. Two widgets: forecast by weeks and by months.
The difference with the Excel of a lifetime: click the account or the balance (he cites €13,000 from the demo) and you are inside the journal entry. That is why Albert does not want to copy/paste outside.
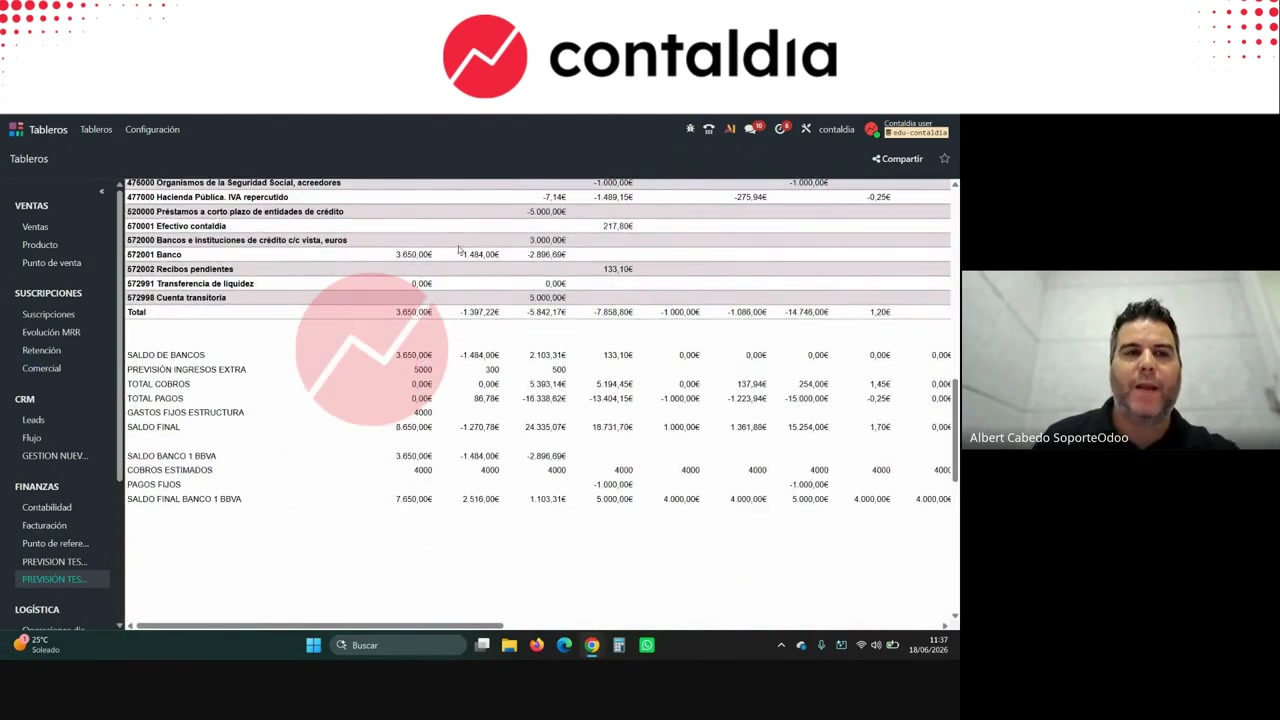
Weeks and months. Clickable cells. It is not a dead Excel outside Odoo.
pivot value). Go back to journal items, add it, insert again. Next year a new bank does not appear on its own: you edit the spreadsheet or regenerate it from journal items and drag. 43002 subaccounts: he says you do not need to have them. Mass change of account on lines: one or all? The real 623 account is changed in Configuration → Chart of Accounts, not line by line. This does not replace a cash-flow statement or the Advances module (AEOdoo sessions; pending release as of the webinar date). He also mentions the channel video on cash flows and mis_builder cash flow (OCA). Spreadsheet is there so you do not copy/paste outside: here the balance is navigable.
Sales by category
Invoice analysis reports: another pivot. Months on top (his habit), product category. Measures: profitability, margin (if the margin module is there), average price, quantity (4 expensive units vs. 1,000 cheap ones). Take that pivot to spreadsheet and drill down the dashboard: country, date, whatever you built.
How long it takes
Albert: one or two hours, once. Then Monday you do not rebuild the filter. The factory one stays for the photo; yours, for the day.
End of session, not the tutorial: event in Madrid the day before. Contaldia client iKit, connection with Odoo. In natural language: leads with no reply in 5 days, dashboard, alert, template email. Artifacts, a layer on top, MCP. He leaves another webinar for that. His warning: if you tell the AI to delete the database, it deletes it.
A dashboard with your accounts, not the demo
Video: YouTube · more sessions at youtube.com/@ContalDia. Courses: contaldia.com.